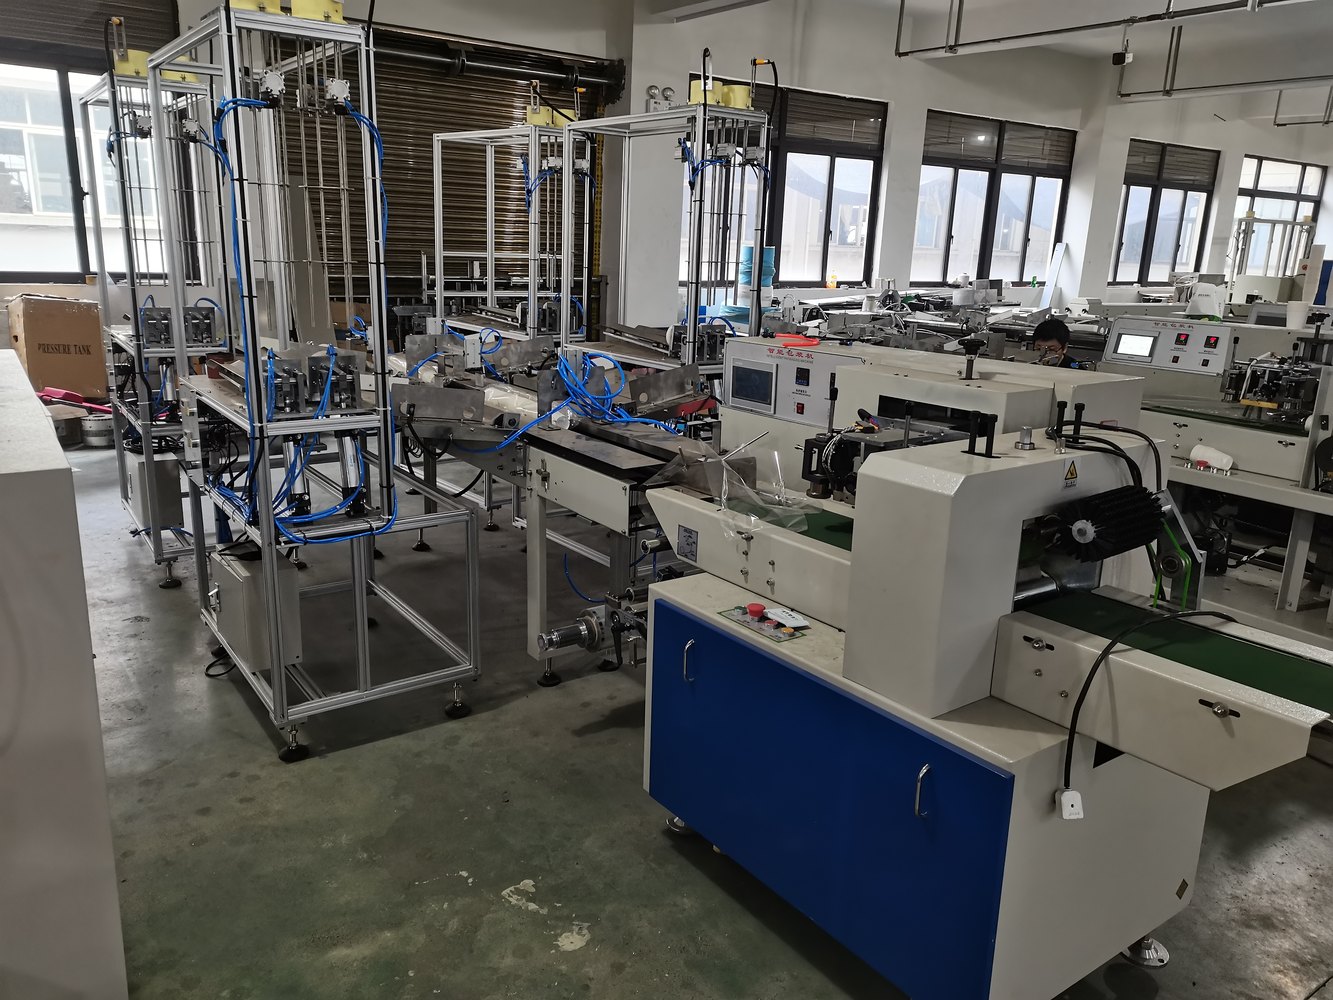
Paper cup production line bottleneck analysis should identify what restricts useful output for an actual product and operating period. A busy machine, a large queue or a low nominal speed can provide a clue, but none alone proves the constraint. Observe material supply, forming, inspection, collection and packing within one defined flow boundary.
Choose a comparable observation period
Identify the cup application, tooling, materials, staffing and pack format. Record whether the period includes startup, changeover, replenishment and interruptions. Compare accepted output rather than combining forming counts with packed quantities as though they represent the same endpoint.
The production records and KPI guide supports those definitions. If records come from different periods or product mixes, normalize the comparison or state that it remains inconclusive.
Follow queues and interrupted flow
A station can wait because it lacks input, stop because the next stage cannot receive output, or lose time to its own fault. Record those states separately. Observe where intermediate cups accumulate and whether the quantity is identified, protected and usable.
Avoid concluding that the largest visible queue is always the problem. It may be a planned buffer or material awaiting a quality decision. Conversely, an empty buffer can reflect insufficient supply rather than smooth production.
| Observation | Evidence to collect | Question to test |
|---|---|---|
| Input waiting | Material readiness and replenishment events | Is the forming stage being supplied? |
| Forming interruption | Event time, application and cause status | Is loss concentrated within this stage? |
| Output blocking | Collection or transfer stops and queue identity | Can downstream work receive cups? |
| Inspection hold | Decision time and held quantity | Does quality release restrict usable flow? |
| Packing shortfall | Accepted packs, conversion and refill work | Is pack capacity aligned with forming output? |
| Supporting workload | Operator tasks and available resources | Is an essential task waiting for ownership? |
| Product change | Setup, verification and clearance duration | Does the SKU mix change the constraint? |
Compare capacity in the same unit
Convert stacks or bags into cups using the approved pack format. For an illustrative example, an accepted packing result of 12 bags per minute with 50 cups per bag represents 600 packed cups per minute during that observation. The numbers are hypothetical, not a capacity specification or recommended target.
Compare that result with accepted upstream flow and the observation boundary. A short packing trial without replenishment does not establish shift capability. The packing options guide explains which supporting tasks belong in the comparison.
Use the SKU scheduling guide when product changes are frequent. A constraint during one long run can differ from the constraint in a mixed-order schedule.
Test a targeted improvement
Choose an action supported by the observed restriction: resolve a material-readiness gap, revise an assigned task, improve transfer arrangements or investigate a recurring fault. Establish the expected result and measurement boundary before the trial.
Compare accepted flow, quality and new queues after the change. An improvement at one station can transfer the constraint elsewhere. Do not declare success because one machine runs faster while the released packed quantity remains unchanged.
For an expanded paper cup production line, request configuration review using the measured workflow. Buying a faster former is a procurement decision that needs evidence of the complete line's ability to use the extra output.
Reconcile the buffer before declaring the constraint
Use the same product unit and time boundary for the entry count, exit count and opening/closing work in process. Record scrap, samples, transfers and stock on hold separately. If the buffer grows, that observation can support a flow imbalance, but it does not by itself show whether packing capacity, an inspection decision or a planned production sequence caused it.
Check the clocks and count points as well. A former’s count recorded at shift end cannot be compared directly with packs recorded earlier and including yesterday’s stock. Preserve the mismatch and obtain aligned records instead of converting the difference into an invented machine-efficiency loss.
State the expected effect of an improvement
For example, a replenishment problem may leave forming starved while packing is available. The proposed trial should test whether an assigned replenishment route reduces that waiting and increases the same accepted-flow endpoint. If released packs do not improve, examine quality holds, new queues and the trial boundary before calling the change successful.
Keep before-and-after product mix and important operating differences visible. The bottleneck may move after a correction or differ across cup formats. A faster station or a smaller queue is useful supporting evidence, not a complete claim of higher shipment capacity.
Frequently asked questions
Is the slowest rated machine always the bottleneck?
Rated figures are a starting reference. Observe accepted output, interruptions and supporting tasks under the actual application before deciding.
Does a queue prove insufficient downstream capacity?
Check whether the queue is planned, held or usable stock, then compare the relevant periods and tasks. A visible queue alone is incomplete evidence.
Should extra operators be added first?
Identify the waiting task and workload before assigning resources. More people will not resolve every tooling, material or transfer restriction.
How should an improvement be judged?
Use a comparable accepted-flow endpoint and review quality, stops and queue movement. Keep the before-and-after conditions explicit.
Share your cup range, observed output and packing workflow with HANNAI for a line-configuration discussion.