Paper cup control chart subgroups determine which variation the chart treats as short-term and which changes it may reveal over time. Pooling cups from different forming positions, material lots and shifts into one convenient sample can conceal a problem. The sampling logic deserves as much attention as the chart software.
This is a sampling-design guide for a quality engineer. Select the chart and statistical assumptions with a competent analyst. Specification limits come from product requirements; control limits describe the observed process and must not be substituted for those requirements.
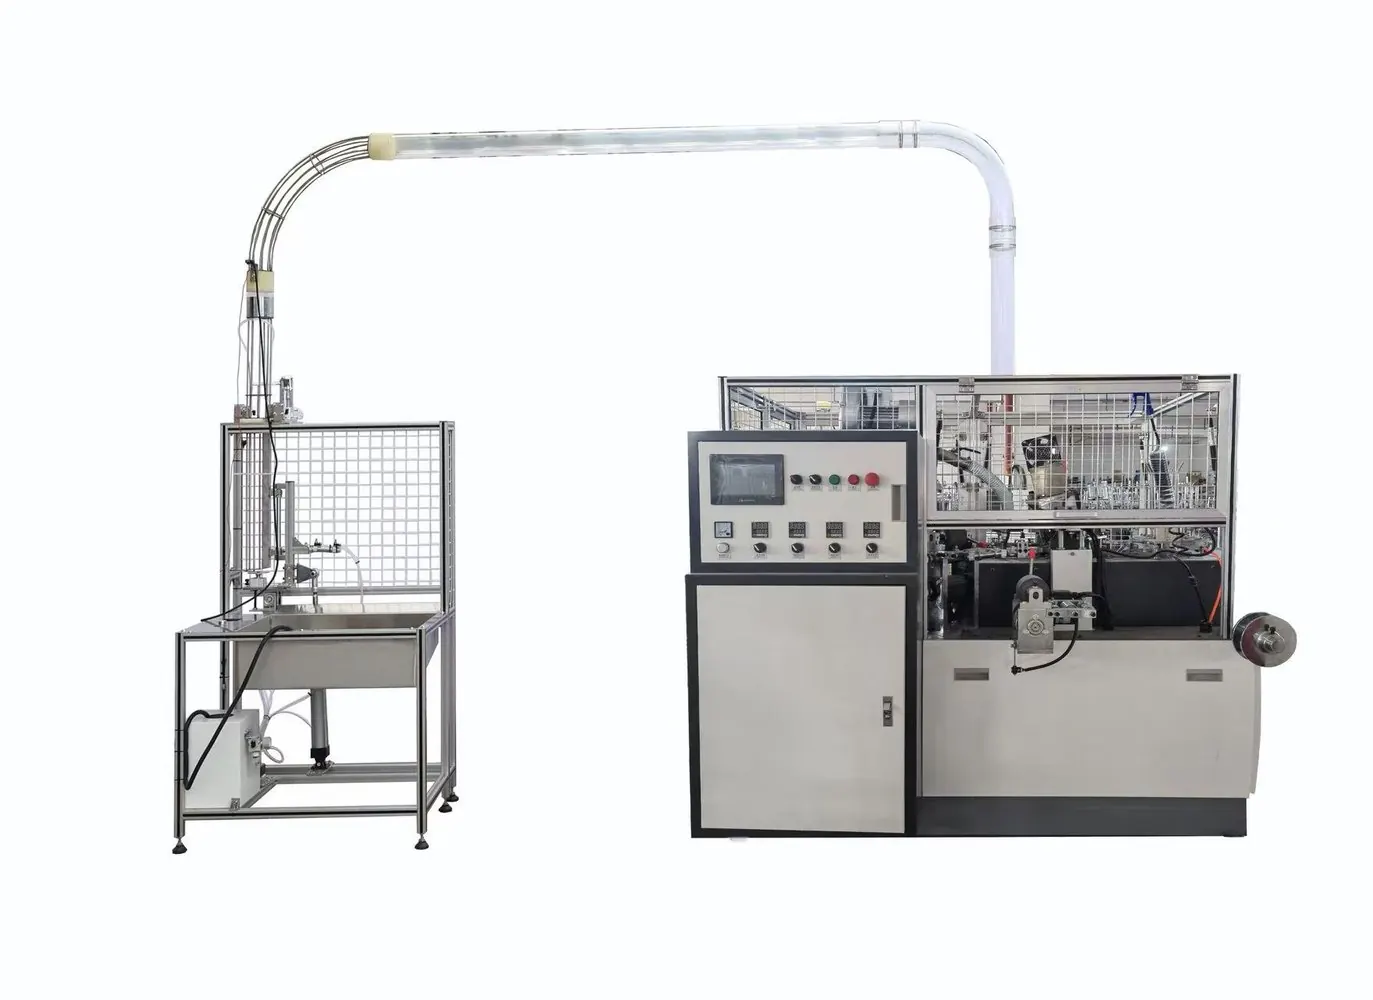
Diagnostic decision table
| Sampling choice | Information preserved | Potential problem |
|---|---|---|
| Nearby cups from one condition | Short-term variation | May omit other forming positions |
| Mixed positions in every subgroup | Overall position mixture | Can hide a position-specific shift |
| All readings pooled by shift | Broad shift summary | Loses time order and interventions |
| Separate streams with timestamps | Position and time behavior | Needs a maintained sampling plan |
Choose one defined measurement stream
Start with a characteristic that has a repeatable measurement method, such as a specified cup dimension at an agreed location. Record its unit, instrument and measurement procedure. Do not combine nominally different cup sizes or material constructions merely because the spreadsheet column has the same name.
Identify the question the chart should answer. Monitoring the stability of one forming position is different from watching the finished output of the whole line. State which production stream is included and which is excluded, and retain the source information needed to revisit that choice if the process changes.
Make subgroup membership deliberate
NIST describes rational subgrouping as a foundation of sensitive Shewhart chart use. For a paper cup application, decide which observations reasonably represent one short-term process condition. Record the collection interval and production state rather than grouping whatever cups happen to reach the inspection bench together.
If several forming positions contribute output, examine whether their centers or variation differ before pooling them. A subgroup containing the same fixed mixture of positions can estimate a different variation source from a subgroup collected at one position. Neither arrangement should be selected solely because it makes the plotted points look quieter.
Preserve time and interventions
Keep each observation linked to its actual collection time, forming position where available, material lot and relevant stop or adjustment. Preserve collection order when measurements are performed later. A laboratory sequence sorted by sample label is not necessarily the order in which the machine produced the cups.
Mark events such as a roll change, tool replacement, restart or measurement-method revision in the record. Do not delete unusual observations automatically. Investigate whether they reflect the process, a recording error or a confirmed measurement failure, and document the evidence supporting any exclusion from a baseline calculation.
Review the baseline before setting alarms
Have the analyst assess an appropriate stable baseline and chart family. Data collected as individual observations, subgroup averages or defect counts require different treatment. If sample sizes vary, ensure the selected analysis accounts for that variation instead of applying constants intended for an unrelated sampling arrangement.
Agree the signal rules and response before operators use the chart. Too many improvised rules can generate confusing alarms, while ignoring repeated signals defeats the purpose of monitoring. Keep the product acceptance decision separate: a stable process can still produce cups outside the agreed dimensional requirement.
Maintain the chart when production changes
Review the sampling plan when a cavity is removed, a new size is introduced or inspection is relocated. These changes can alter the meaning of the observations even if the worksheet still calculates without an error. Preserve the original baseline and explain any authorized recalculation rather than resetting limits to absorb an unexplained shift.
A useful handoff to HANNAI includes the time-ordered readings, subgroup definition, event log and corresponding cup drawing. Share the raw values as well as the chart image. This allows a process investigation to connect a signal with the relevant machine condition instead of interpreting a plot without its production context.
Related equipment and next checks
Review the HN-S120 paper cup machine and the related guide to process capability readiness. The Engineering Notes archive connects these checks with wider machine planning.
Technical reference
- NIST: statistical terminology and rational subgroups — general reference; confirm applicability to the installed equipment.
Frequently asked questions
Are control limits the same as product tolerances?
No. They serve different purposes and come from different evidence.
Can different cup sizes share one raw dimensional chart?
Do not pool them without an analysis designed for their different targets and variation.
Should every unusual point be removed?
No. Investigate and document the cause before deciding how it affects the baseline.
Does a stable chart guarantee acceptable cups?
No. Compare the product measurements with the approved requirements separately.
Review the evidence with HANNAI
Send your machine model, component identification and the observations described in this guide. Include the drawing or material reference and any before-and-after measurements so the required next check can be identified.